
Accelerating the Just Energy Transition in Indonesia
In the past year, Indonesia has set ambitious targets to reduce greenhouse gas emissions by 29-41% by 2030 and achieve carbon neutrality by 2060. To meet these goals, Indonesia has committed to decommission coal-fired power plants by 2050 and cancel some coal projects currently in development.
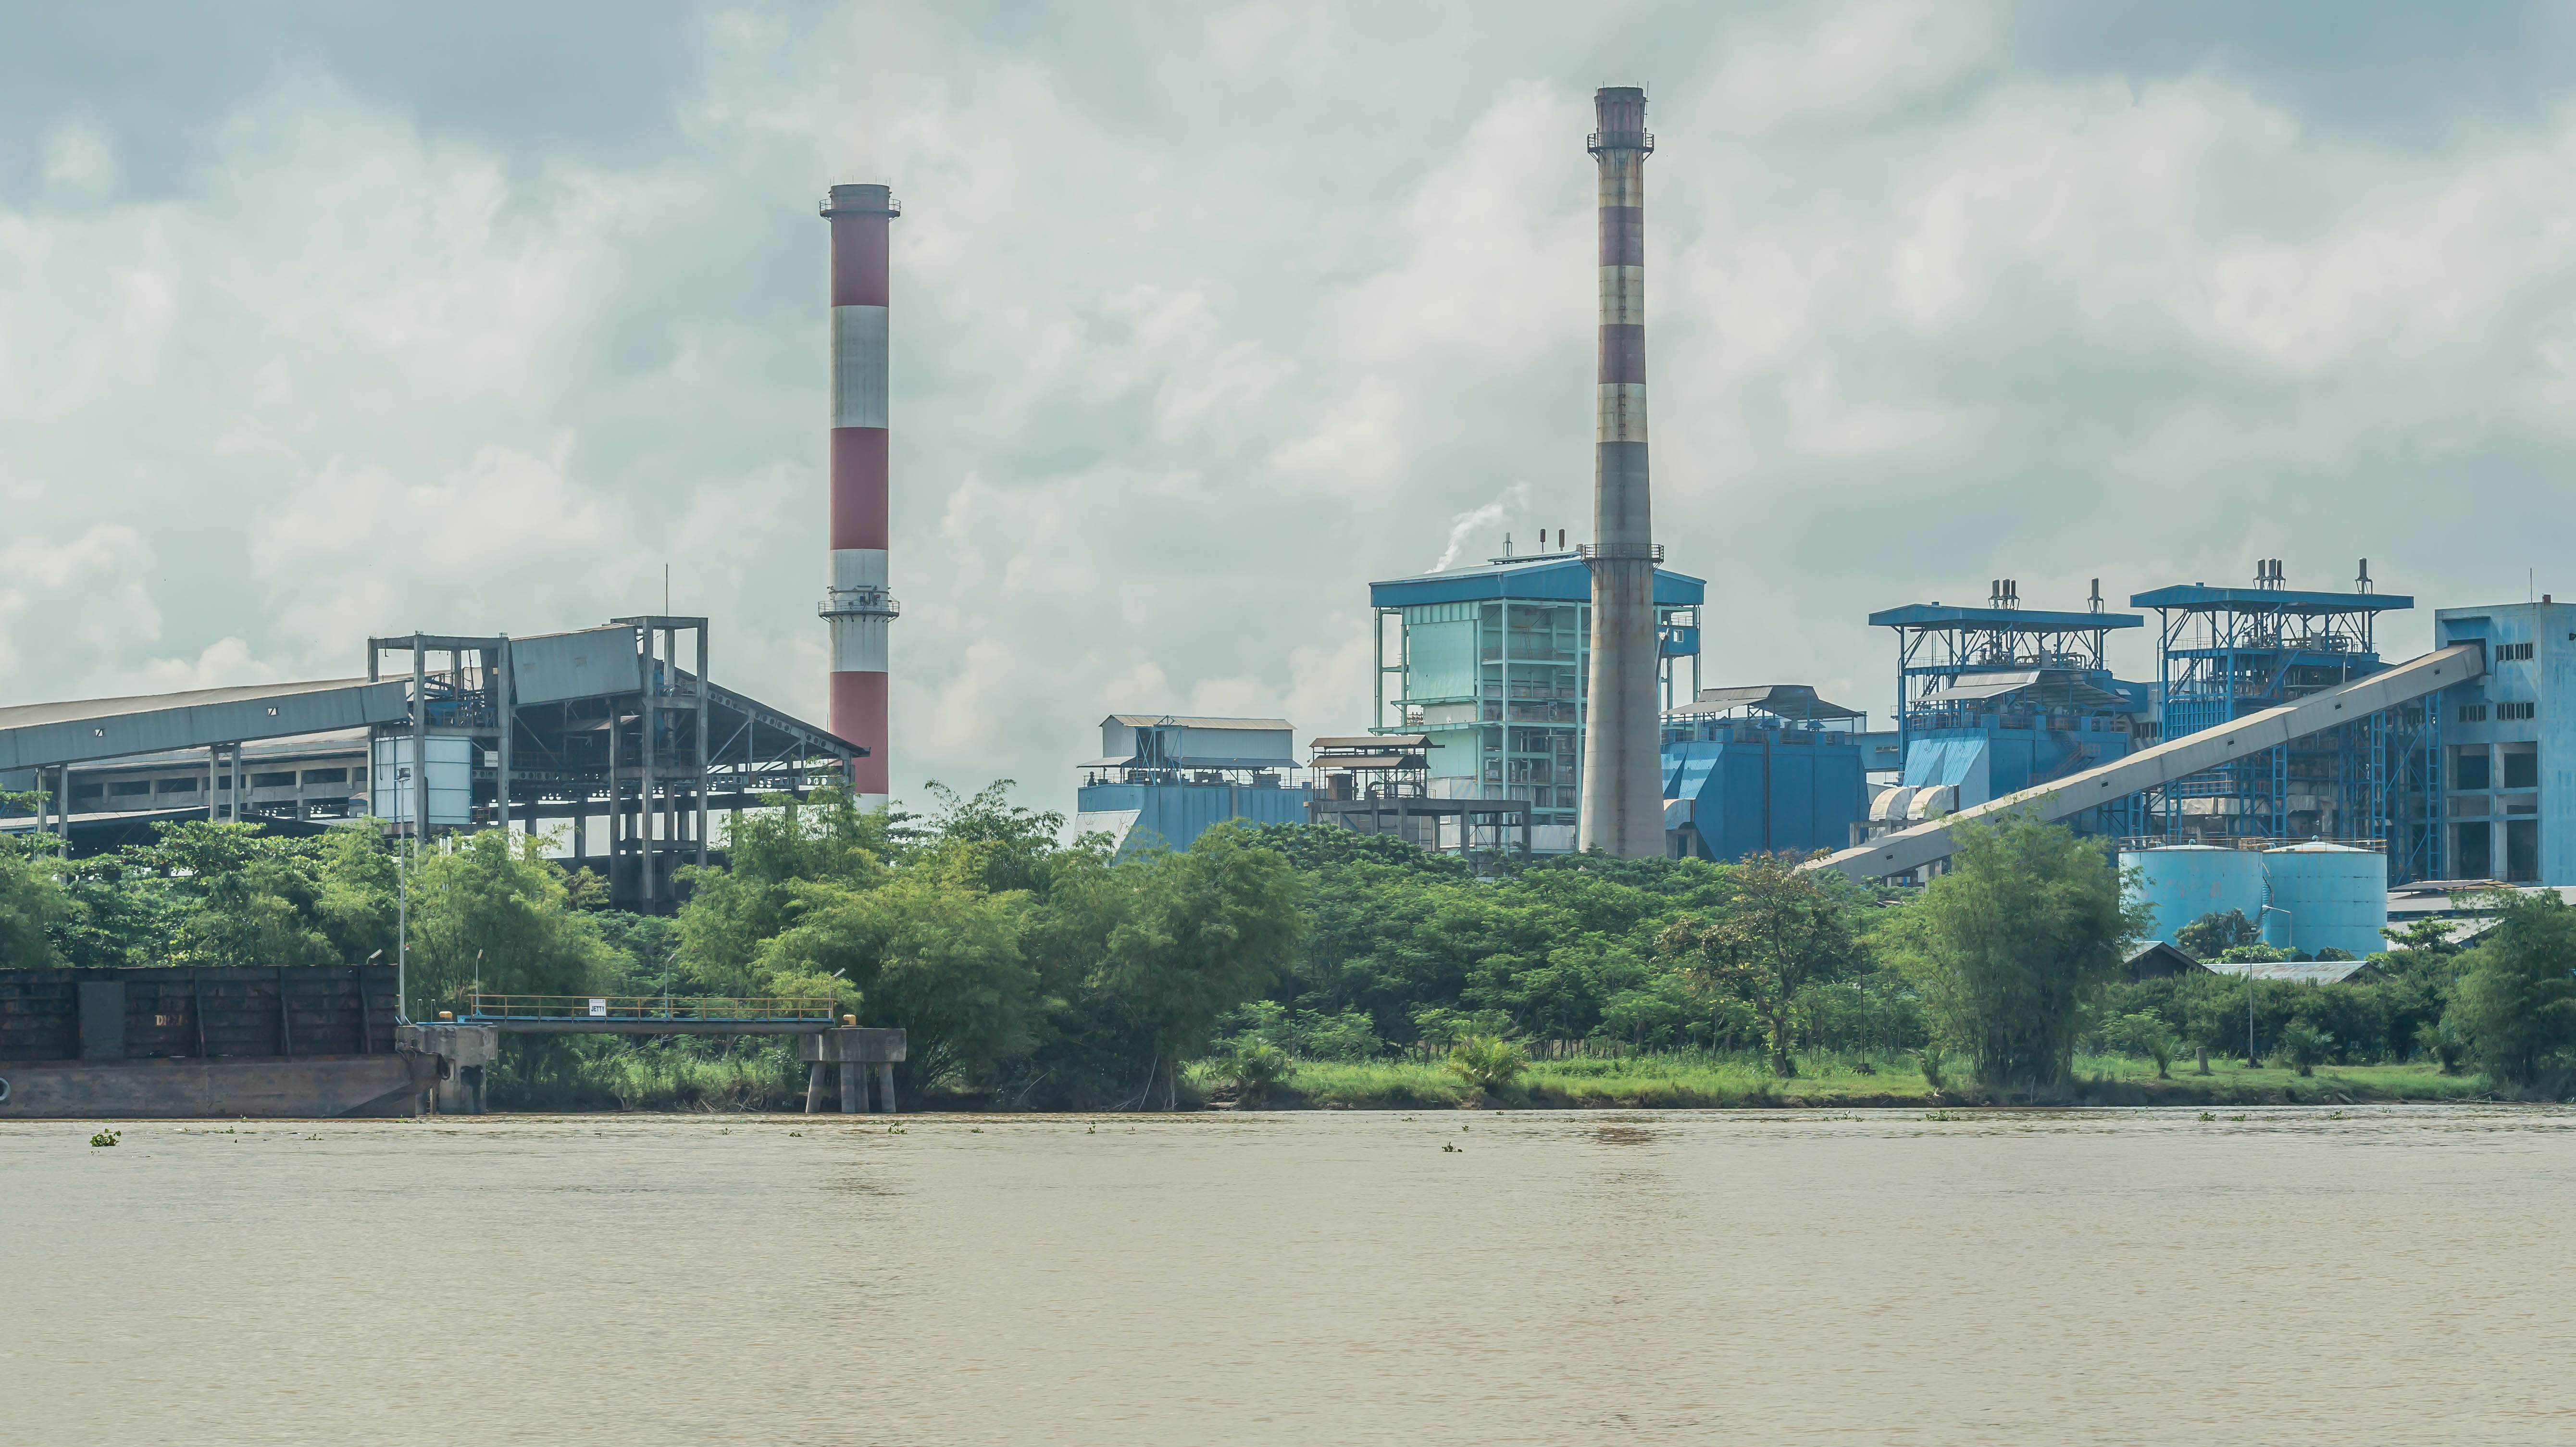
This is a step in the right direction as Indonesia has one of the most coal-dependent power sectors in the world. It has the world’s 6th largest fleet of operational coal-fired power plants which produce 63% of the country’s electricity.
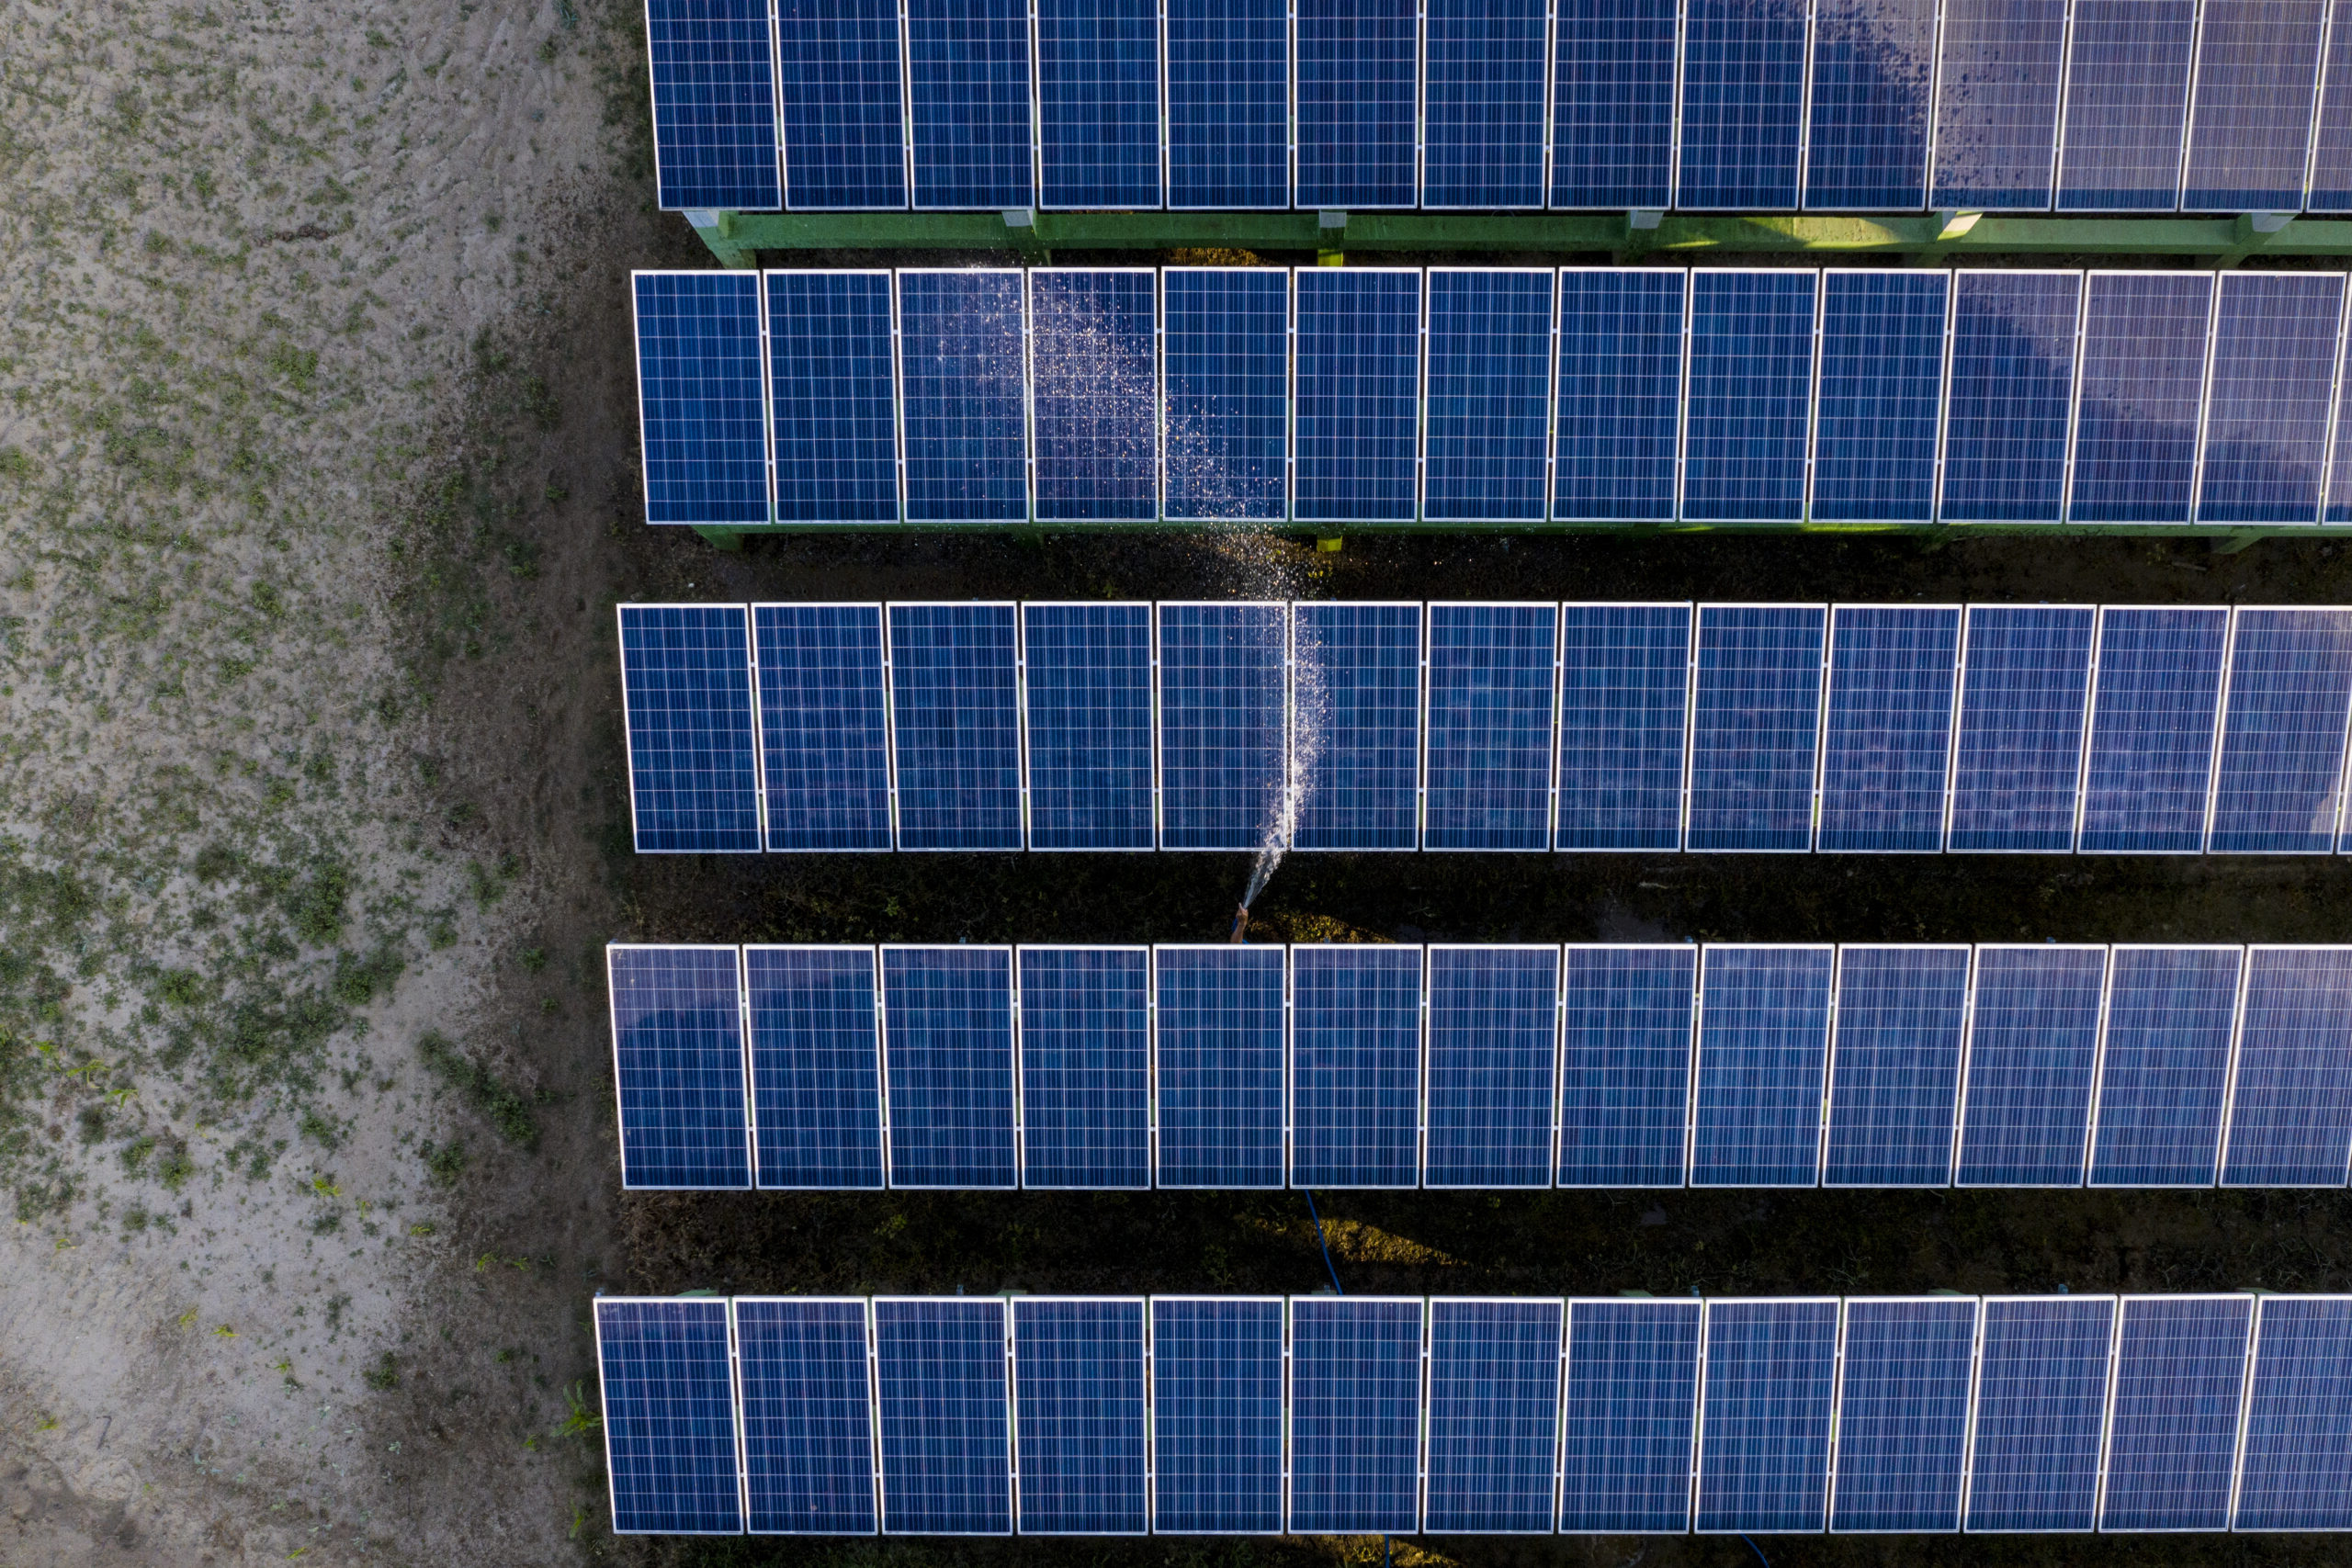
To expedite the process and quickly transition to cleaner sources of energy, Indonesia needs an improved enabling environment for renewable energy deployment and greater access to capital. New financial solutions are needed to attract the concessional capital that will enable Indonesia to replace existing coal-fired power with clean energy sources.
With support from the Alliance and partners like the Asian Development Bank, the government of Indonesia is currently establishing an Energy Transition Mechanism (ETM) Country Platform. The intention behind the ETM is to help shorten the economic lives of coal-fired power plants, accelerate investments in renewable energy, and re-skill workers so that their livelihoods are protected. The ETM is designed to serve as a platform to plan, coordinate, and mobilize capital from a variety of sources to finance the early retirement of coal-fired power plants.
There is a broad need, in Indonesia and beyond, for new climate finance mechanisms that can help accelerate the transition away from coal. To facilitate this needed finance, the Indonesian government, the Alliance, and partners are developing a new approach to monetizing avoided carbon emissions associated with the early retirement of coal-fired power plants. A successful pilot project in Indonesia offers the potential to replicate across other coal-reliant countries such as India and South Africa.
Indonesia’s energy transition plan also extends to the phase-out of diesel generators installed in 2,130 locations across Indonesia. The alliance seeks to accelerate the replacement of diesel generators with renewables by partnering with the government, state utility, private sector, and an alliance partner.
Related News
-
 BlogFlip the Switch: Collaborative Platforms Aiding the Energy…Flip the Switch: Collaborative Platforms Aiding the Energy…09.01.2024AfricaGlobal
 -
 Press ReleaseGlobal Energy Alliance and CHD mobilize US$50M to…Global Energy Alliance and CHD mobilize US$50M to…07.06.2023GlobalNigeria
 -
 Press ReleaseVietnam and Global Energy Alliance for People and…Vietnam and Global Energy Alliance for People and…23.02.2023Vietnam